

Environmental Monitoring Projects for Australian Schools
July 17, 2026
Environmental Monitoring Projects for Australian Schools
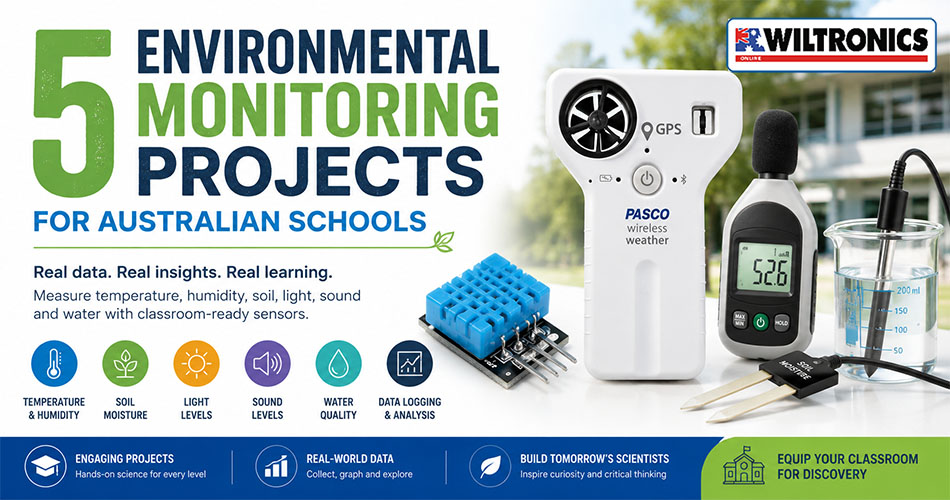
Environmental monitoring projects turn classrooms, gardens and school grounds into practical science laboratories.
Instead of analysing a supplied dataset, students collect their own measurements. They can compare locations, track changes over time, identify patterns and evaluate how well their evidence answers a scientific question.
A class might investigate why one room becomes warmer than another, which garden bed retains the most moisture, where noise levels change throughout the day or how approved water samples compare.
Wiltronics supplies a broad range of science equipment for schools, including portable meters, programmable sensors and digital data-logging equipment for environmental investigations.
These projects build naturally on the practical skills introduced in our Term 3 science experiments for Australian schools and Term 3 STEM projects and classroom electronics guide.
Choosing an environmental monitoring project
The most suitable investigation will depend on student experience, available lesson time and whether readings will be collected manually or digitally.
| Project pathway | What students can measure | Suggested investigation |
|---|---|---|
| Temperature and humidity monitoring | Indoor and outdoor conditions | Which school location has the most stable conditions? |
| Soil properties and moisture | Moisture levels and changes after watering | Which soil or location retains moisture longest? |
| Sound and light measurement | Illumination and noise levels | How do conditions change throughout the school day? |
| Water-quality measurement | pH, salinity, conductivity and temperature | How do approved water samples compare? |
| PASCO wireless data logging | Environmental change over time | What patterns appear in a long-term dataset? |
A successful project does not require the most advanced sensor available. Consistent measurement, a focused question and a suitable number of readings matter more than collecting large quantities of unfocused data.
1. Compare temperature and humidity around the school
Temperature and humidity can vary between classrooms, corridors, shaded outdoor areas and locations exposed to direct sunlight.
Students can investigate these differences by choosing several locations and recording conditions at consistent times.
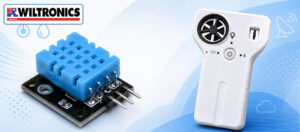
For a coding-based project, the DHT11 temperature and humidity sensor module combines both measurements in one Arduino-compatible module.
Schools planning more advanced environmental fieldwork can use the PASCO Wireless Weather Sensor with GPS. It combines multiple environmental measurements with GPS and can be used for microclimate mapping and longer-term logging activities.
Project question
How do temperature and humidity vary between different areas of the school?
Students could compare:
- occupied and unoccupied classrooms
- indoor and outdoor locations
- shaded and sun-exposed areas
- rooms facing different directions
- conditions before and after lunchtime
- readings taken at different heights
Suggested method
- Choose three or more measurement locations.
- Mark or photograph the exact sensor position.
- Take readings at the same times each day.
- Record sunlight, ventilation and room occupancy.
- Continue the investigation for several days.
- Graph each location as a separate dataset.
- identify patterns and possible explanations.
Sensors should be given time to adjust after being moved between locations. A reading taken immediately after moving from direct sunlight into shade may not represent the new environment accurately.
Extension activity
Ask students to recommend one practical change that could improve classroom comfort or reduce unnecessary heating and cooling.
Their recommendation should be supported by the collected evidence rather than personal preference.
2. Investigate soil moisture and water retention
Soil moisture projects connect environmental science with biology, agriculture, horticulture, coding and water conservation.
Students can compare soil types, garden locations, watering schedules, sunlight exposure or the use of mulch.
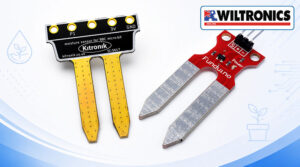
The Arduino-compatible soil moisture sensor provides an analogue output that changes as moisture levels change. It can also become part of a programmed watering alert or automation project.
For micro:bit classes, the Kitronik Prong Soil Moisture Sensor mounts directly to a BBC micro:bit and provides an analogue moisture reading that students can use in MakeCode projects.
Project question
Which conditions help soil retain moisture for the longest time?
Possible comparisons include:
- sandy, loamy and clay-rich soils
- covered and uncovered soil
- shaded and sunny locations
- different container sizes
- mulched and unmulched soil
- morning and afternoon watering
- different watering volumes
Create a fair comparison
Every container should begin with the same amount of soil and water unless one of those factors is the independent variable.
Students should also insert the probe to the same depth each time. A reading taken close to the surface may differ from one taken near the bottom of the container.
| Time | Soil or location | Moisture reading | Air temperature | Observations |
|---|---|---|---|---|
| 9:00 am | Sample A | |||
| 12:00 pm | Sample A | |||
| 3:00 pm | Sample A |
Recording temperature, sunlight and visual observations can help explain why moisture levels changed.
Extension activity
Students can build a simple watering alert using the Wiltronics Arduino and Arduino-compatible range or BBC micro:bit products.
The program could activate an LED or buzzer when the reading falls below a selected threshold. Students must justify the chosen threshold and consider whether the same setting would suit every plant or soil type.
3. Map light and sound levels across the school
Light and sound are easy to notice but difficult to compare objectively without measurement equipment.
A school mapping project allows students to collect readings in classrooms, corridors, libraries, outdoor spaces and shared learning areas. They can then explore how conditions change according to location, time and activity.
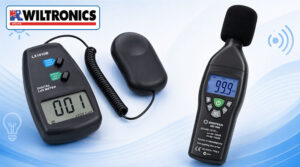
The digital light meter with a 0–50,000 lux range has selectable ranges for indoor and outdoor measurements.
The digital sound level meter provides selectable measurement ranges, time weighting and frequency weighting for sound investigations.
Project question
How do light and sound levels change across the school day?
Possible locations include:
- a desk beside a window
- the centre of the same classroom
- the library
- a corridor during class and break times
- the school entrance
- an outdoor eating area
- a technology or music room
Keep the method consistent
For light readings, students should use the same sensor orientation and avoid blocking the sensor with their body.
For sound readings, they should keep the meter at a consistent height and record whether the area was occupied. Announcements, passing vehicles, musical instruments or nearby construction should be noted.
Turn the readings into a map
Students can add their results to a simple plan of the school.
Colour coding can represent different measurement ranges. The class could create separate maps for morning and afternoon conditions or compare sound and light in the same locations.
Ask students to evaluate:
- which locations showed the greatest variation
- whether the quietest areas were always the least occupied
- whether bright areas depended on daylight or artificial lighting
- how representative one measurement would be
- what additional readings would strengthen the conclusion
One high or low result should not be used to label a location without suitable repetition and context.
Planning a classroom environmental monitoring project? Contact the Wiltronics team to discuss suitable sensors, meters and quantities for your school.
4. Compare approved water samples
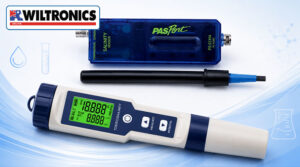
Water investigations can introduce students to temperature, pH, total dissolved solids, electrical conductivity, salinity and turbidity.
The parameters selected should suit the students’ experience, available equipment and school procedures.
The 5-in-1 Water Quality Tester combines pH, TDS, electrical conductivity, salinity and temperature measurement in one portable instrument.
The PASCO PASPort Salinity Sensor measures salinity, conductivity and temperature, making it suitable for more detailed digital investigations.
Project question
How do approved water samples compare across locations or conditions?
Classroom-controlled comparisons might include:
- tap water collected from different school buildings
- prepared fresh and saltwater samples
- water stored in shade and sunlight
- filtered and unfiltered prepared samples
- samples before and after an approved treatment process
Field samples should only be collected under school procedures and appropriate supervision.
Suggested process
- Label every sample clearly.
- Record the source, date and collection time.
- Measure temperature before conditions change.
- Clean or rinse probes according to their instructions.
- Test samples in a consistent order.
- Repeat measurements where appropriate.
- Compare the results without relying on appearance alone.
Students should understand that one parameter cannot provide a complete assessment of water quality. A clear-looking sample may still produce different pH, conductivity or salinity readings.
Unknown water and laboratory samples must never be consumed. Suitable hygiene, protective equipment and waste procedures should be followed.
Extension activity
Students can compare two or more parameters and look for relationships between them.
For example, they could investigate whether samples with higher conductivity also produce higher salinity readings, then consider whether their dataset is large enough to support a broader conclusion.
5. Reveal patterns with digital data logging
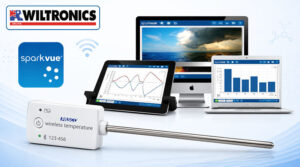
Manual readings work well for location comparisons and short activities. Digital data logging becomes useful when students need to study changes over several minutes, hours or days.
Instead of recording one temperature, students can collect a sequence that reveals heating, cooling and daily fluctuations. Compatible systems can also log soil, light, pH and other environmental measurements.
The PASCO Wireless Temperature Sensor is a general-purpose sensor with a stainless steel probe and onboard logging capability.
PASCO’s SPARKvue software and interfaces support data collection and analysis with compatible wireless and PASPort sensors.
Project question
What patterns become visible when environmental measurements are collected over time?
Students might monitor:
- classroom temperature across a full day
- light levels beside a window
- soil moisture after watering
- shaded and exposed outdoor temperatures
- water temperature during heating or cooling
- pH changes during an approved investigation
Choose a useful sampling interval
The sampling interval should match the speed of the expected change.
A rapidly changing experiment may require readings every few seconds. A classroom microclimate investigation might use readings every few minutes, while soil moisture could be recorded less frequently.
Collecting the largest possible dataset is not automatically useful. Students should choose an interval that captures the expected pattern without producing unnecessary data.
Graph and interpret the results
Time is generally placed on the horizontal axis, with the measured condition on the vertical axis.
Students should:
- include appropriate units
- give the graph a clear title
- identify each dataset
- note unusual events
- describe the overall pattern
- separate observation from explanation
For more classroom examples, see PASCO Wireless Sensors Bring Science to Life. PASCO wireless sensors can connect to compatible computers, tablets and mobile devices for live collection and analysis.
Portable meters, Arduino or PASCO?
Each approach supports a different type of learning.
Portable meters
Portable meters provide immediate readings with minimal setup. They suit projects focused on sampling, measurement technique and location comparisons.
Explore environment monitors and test equipment for temperature, humidity, light, sound and related measurements.
Arduino and micro:bit sensors
Programmable sensors combine environmental science with electronics and coding.
Students connect the sensor, interpret its output and write a program that displays, records or responds to the result.
The Wiltronics guide to ARD2 Arduino-Compatible STEM Resources for Schools provides a broader introduction to microcontrollers, sensors and classroom projects.
PASCO sensors and data logging
PASCO systems suit investigations where students need to collect, graph and compare digital data efficiently.
Wireless sensors can connect directly to compatible devices, while PASPort sensors use suitable interfaces. Learn more in Data Logging and Wireless Tools for Modern Science Labs.
Reliable environmental investigation checklist
Environmental conditions rarely remain constant. A single reading may reflect a brief event rather than a dependable pattern.
Before students begin, confirm that the investigation includes:
A focused question
Avoid a broad question such as:
What is the environment like at our school?
A stronger question identifies the measurement, locations and duration:
How does soil moisture change over five school days in shaded and sun-exposed garden beds?
Repeatable locations
Use labels, photographs, maps or marked positions so measurements can be repeated in the same place.
Consistent timing
Take measurements at comparable times or record the time as part of the dataset.
Controlled variables
Keep sensor height, orientation, depth, sample volume and measurement duration consistent where possible.
Repeated readings
Repeat measurements to identify variation and reduce the influence of unusual results.
Contextual observations
Record weather, occupancy, watering, open windows and unexpected activities that might explain a change.
Evidence-based evaluation
Students should explain:
- the pattern shown by their results
- whether the evidence supported their prediction
- which part of the method introduced the most uncertainty
- how the method could be improved
- what should be investigated next
They should identify a specific limitation rather than stating only that “human error” affected the results.
Differentiating environmental monitoring projects
Foundation level
Provide the question, locations, equipment list and results table.
Students focus on taking readings correctly, recording units and describing an observable pattern.
Intermediate level
Provide the topic and equipment, but ask students to choose the locations, measurement interval and controlled variables.
Students graph their results and evaluate whether the evidence supports their prediction.
Extension level
Ask students to design the investigation and justify the selected sensor.
Extension students could:
- compare manual and digital readings
- program an automated monitoring system
- combine two environmental variables
- calculate averages and ranges
- map spatial data
- design an automatic watering alert
- propose a follow-up investigation
Classroom preparation checklist
Before the lesson, check that the class has:
- charged devices and fresh batteries
- suitable cables, interfaces and sensor leads
- labelled sample containers
- clipboards or digital recording sheets
- clear maps or location labels
- cleaning and calibration materials
- suitable laboratory equipment and supplies
- organised parts storage boxes and cabinets
- approved fieldwork and safety procedures
Test every sensor before the activity. A short teacher trial can identify flat batteries, connection problems, unsuitable sampling intervals and locations that do not produce useful comparisons.
The Wiltronics guide to Environmental Test Equipment Explained provides additional background on collecting and analysing environmental measurements.
Frequently asked questions
What is a good environmental science project for beginners?
A temperature comparison between three school locations is an accessible starting point.
Students can take manual readings at consistent times, graph the results and explain why conditions may differ.
How long should an environmental monitoring project run?
A single lesson can compare locations at one point in time, but projects lasting several days usually reveal more meaningful patterns.
The duration should match the variable. Sound and light may change within minutes, while soil moisture can be monitored over several days.
Do students need coding experience?
No. Portable meters allow students to focus on scientific measurement without programming.
Arduino and micro:bit sensors are suitable when coding and electronics are also part of the learning goal.
How many sensors does a class need?
Many projects work well with one sensor per pair or small group.
Schools can also create measurement stations and rotate groups, provided each student has an active role in collecting, recording or analysing data.
Can sensors be used outdoors?
Some equipment can be used outdoors for supervised measurements, but teachers should check the product instructions and operating conditions first.
Consider weather, traffic, uneven surfaces, water hazards, sun exposure and how the equipment will be transported.
What should students do when readings vary?
Variation is a normal part of environmental science.
Students should repeat the reading, check their technique, record relevant conditions and avoid removing a result simply because it differs from their prediction.
Start measuring the world around your school
Environmental monitoring projects help students see familiar spaces from a scientific perspective.
By investigating classroom comfort, garden moisture, school noise, available light and approved water samples, students develop practical skills in measurement, coding, graphing and evidence-based evaluation.
Explore the Wiltronics ranges of Arduino-compatible environmental sensors, PASCO data-logging equipment and science equipment for Australian schools.
For assistance selecting sensors, interfaces or classroom quantities, contact the Wiltronics team.
© Electrotech Brands Pty Ltd 2026
Write a Comment
You must be logged in to post a comment.